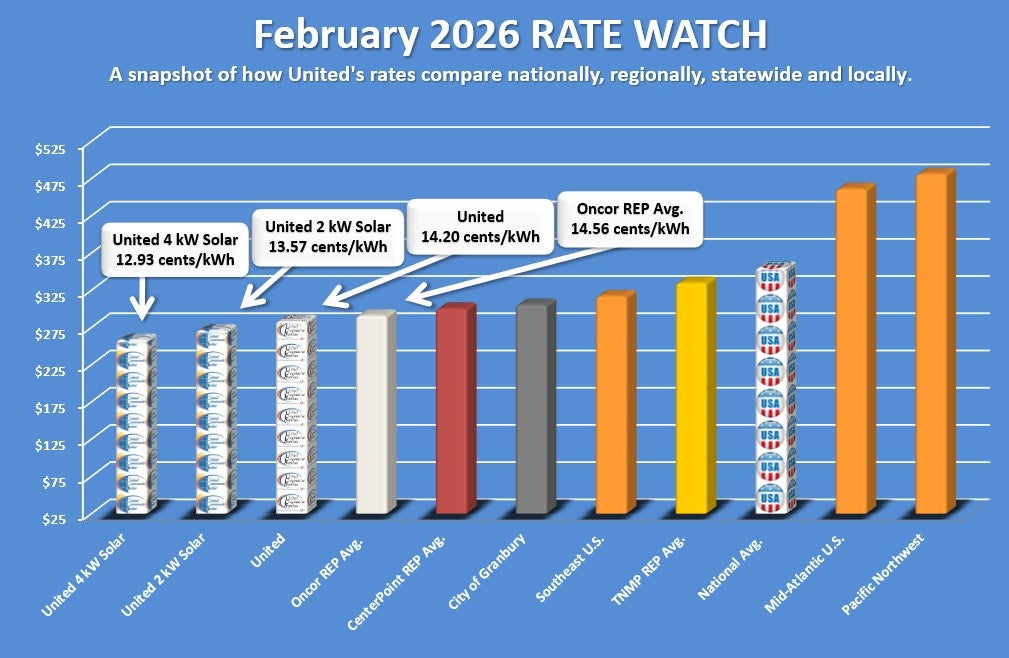
The information obtained to develop Rate Watch uses the most recent data available at the time of publication and is sourced from several entities, including the U.S. Energy Information Administration and powertochoose.org. The comparison is based on 2,000 kWh of usage. This month’s chart also shows how United’s solar rates compare in the mix. EDITOR’S NOTE: National data from EIA is current as of July 2025.
